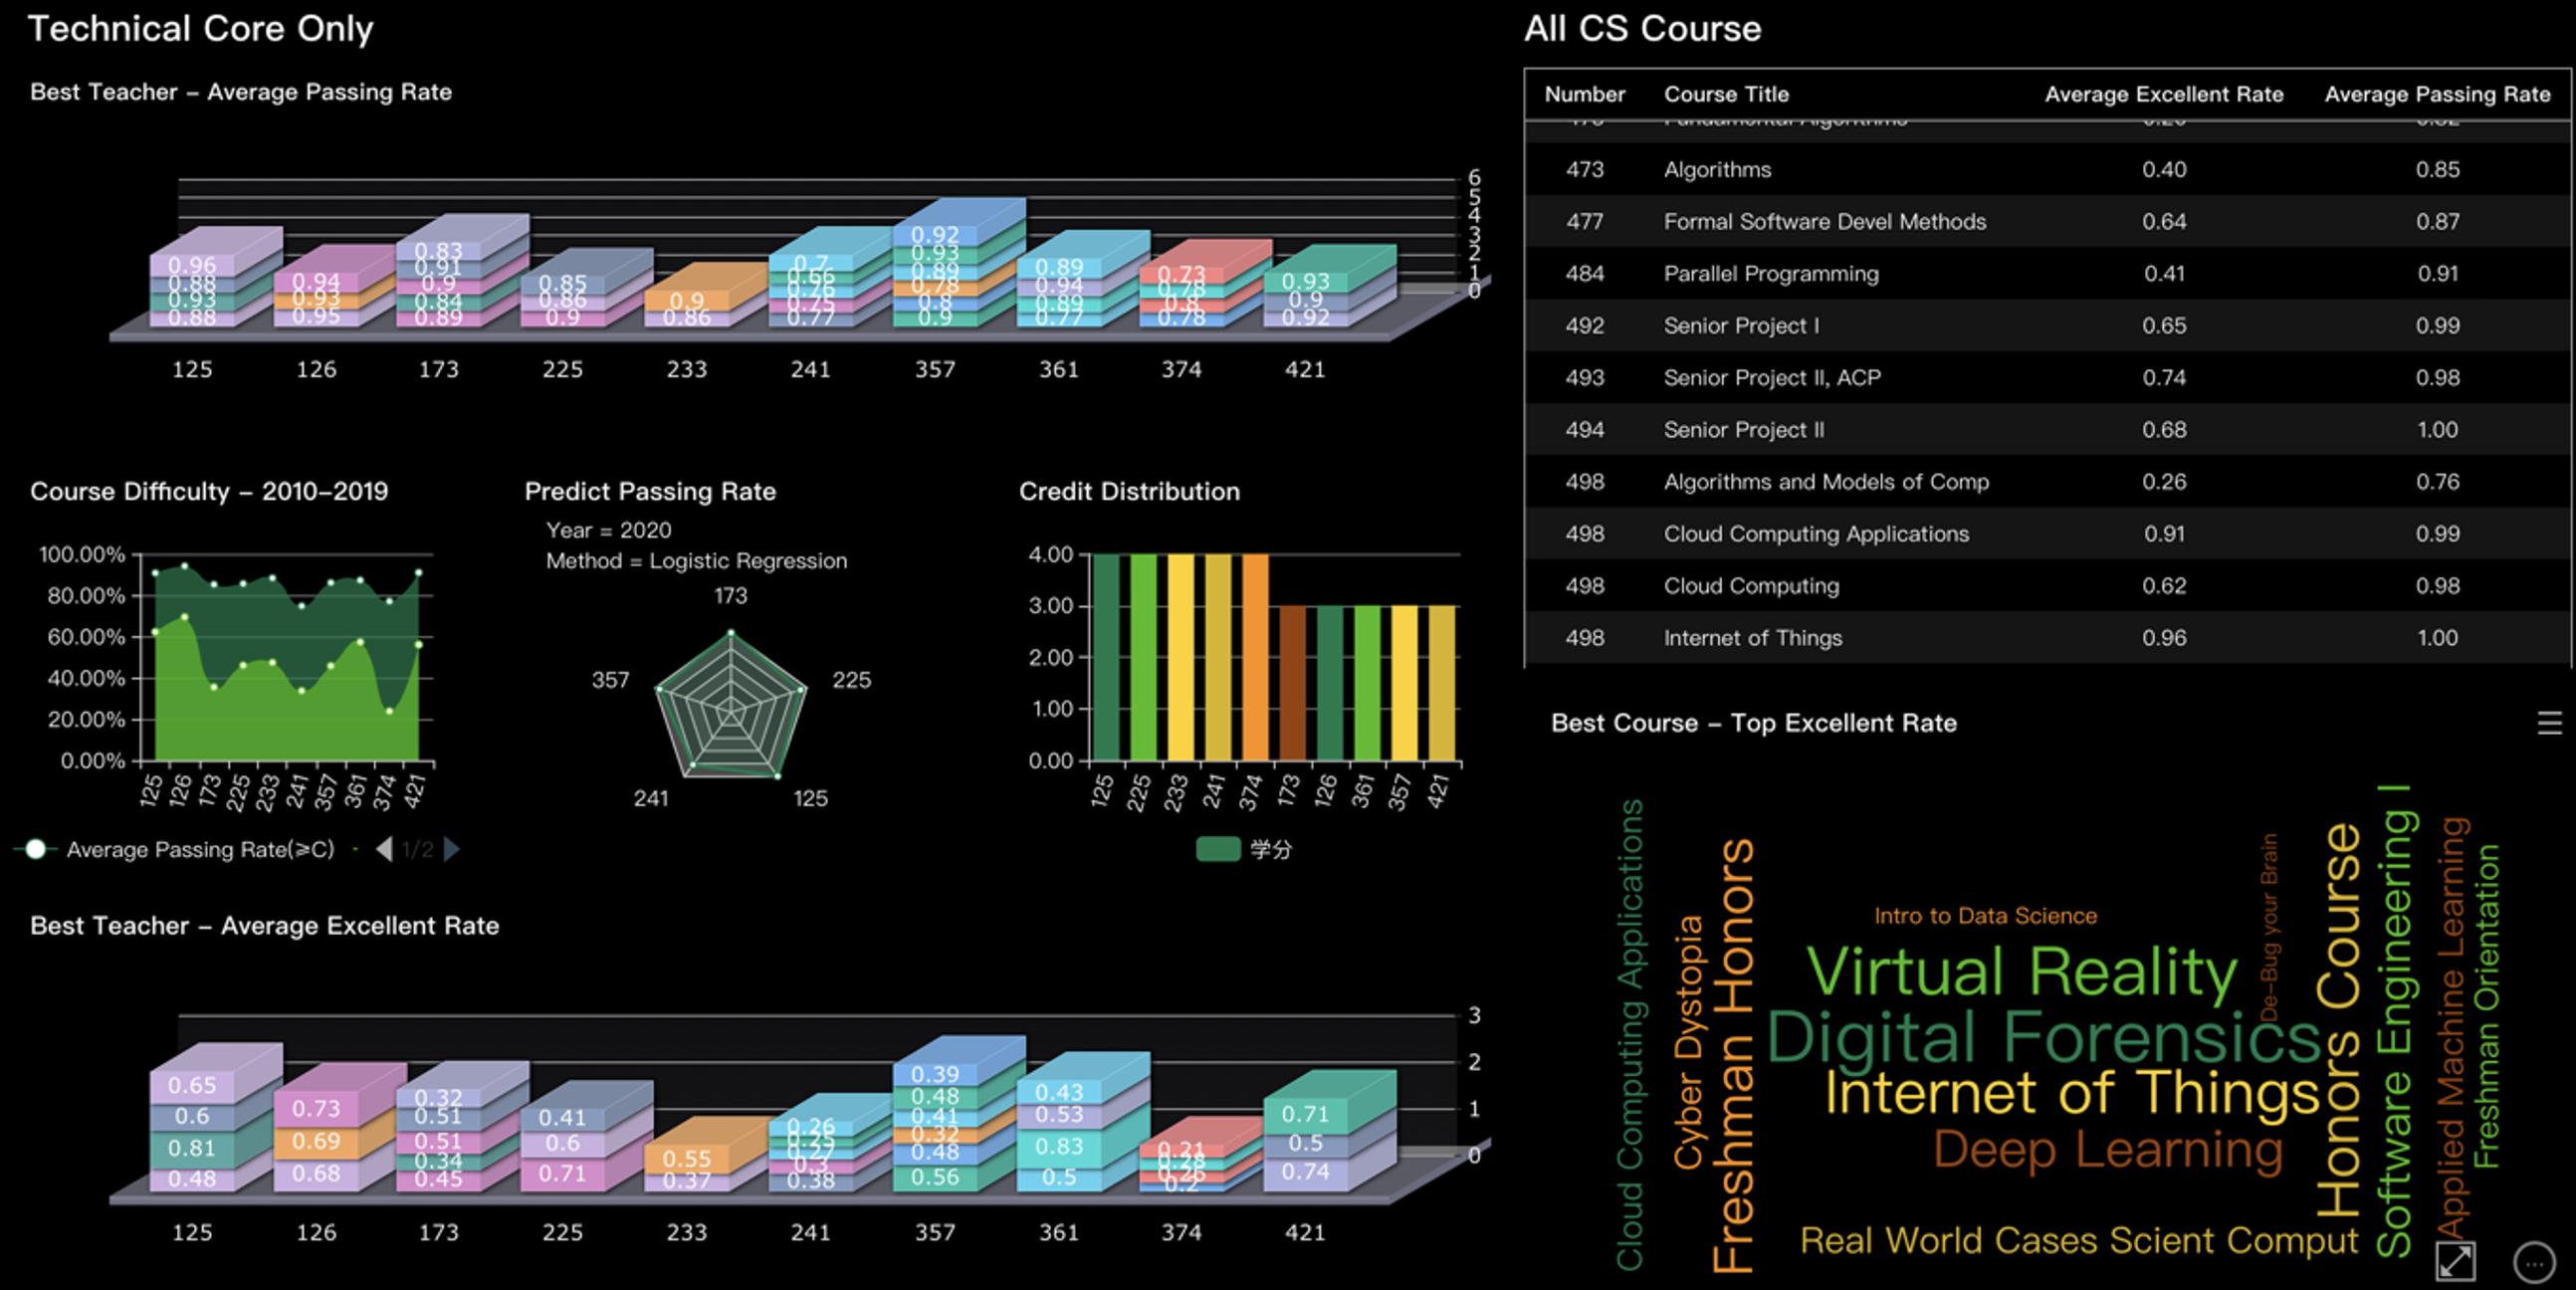
In my junior year, I did a data visualization project with SaCa DataViz. I did this project to meet the requirements of object-oriented Modeling and Analysis course.

What is Saca DataViz?
Saca DataViz is developed by Neusofta. It is a self-developed self-service data exploration and visualized analysis platform that provides multi-data source access, lightweight data modeling, self-service visualized analysis tools, interactive storyboards and other functions. Aim to offer business personnel the self-service data exploration and visualized analysis services with high efficiency and low costs so that they can deeply analyze data and thoroughly seek business value. You can learn more about the platform on Neusoft’s official website
In my opinion, the Saca platform is very similar to Tableau.
Steps of the project
1. Find a dataset and take a look at the data format
I got my dataset from waf.cs.illinois.edu
The dataset contains 9 columns: Course ID Course Title, Primary Instructor and the number of students who got A, B, C, D, F, W in the last five years.
2. Understand the application scenario
Students choose courses to meet graduation requirements. Through this link, I learned about UIUC’s graduation requirements.
Based on the graduation requirements, I have determined that my project should include two aspects: one is based on Computer Science Technical Core, and the second is based on all courses.
3. Understand user needs
As students, we usually hope to choose:
- courses with as many credits as possible
- courses with high excellent rate and high pass rate